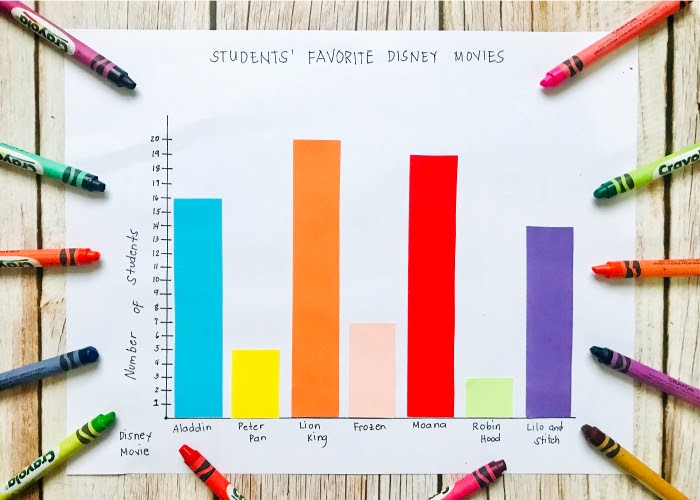
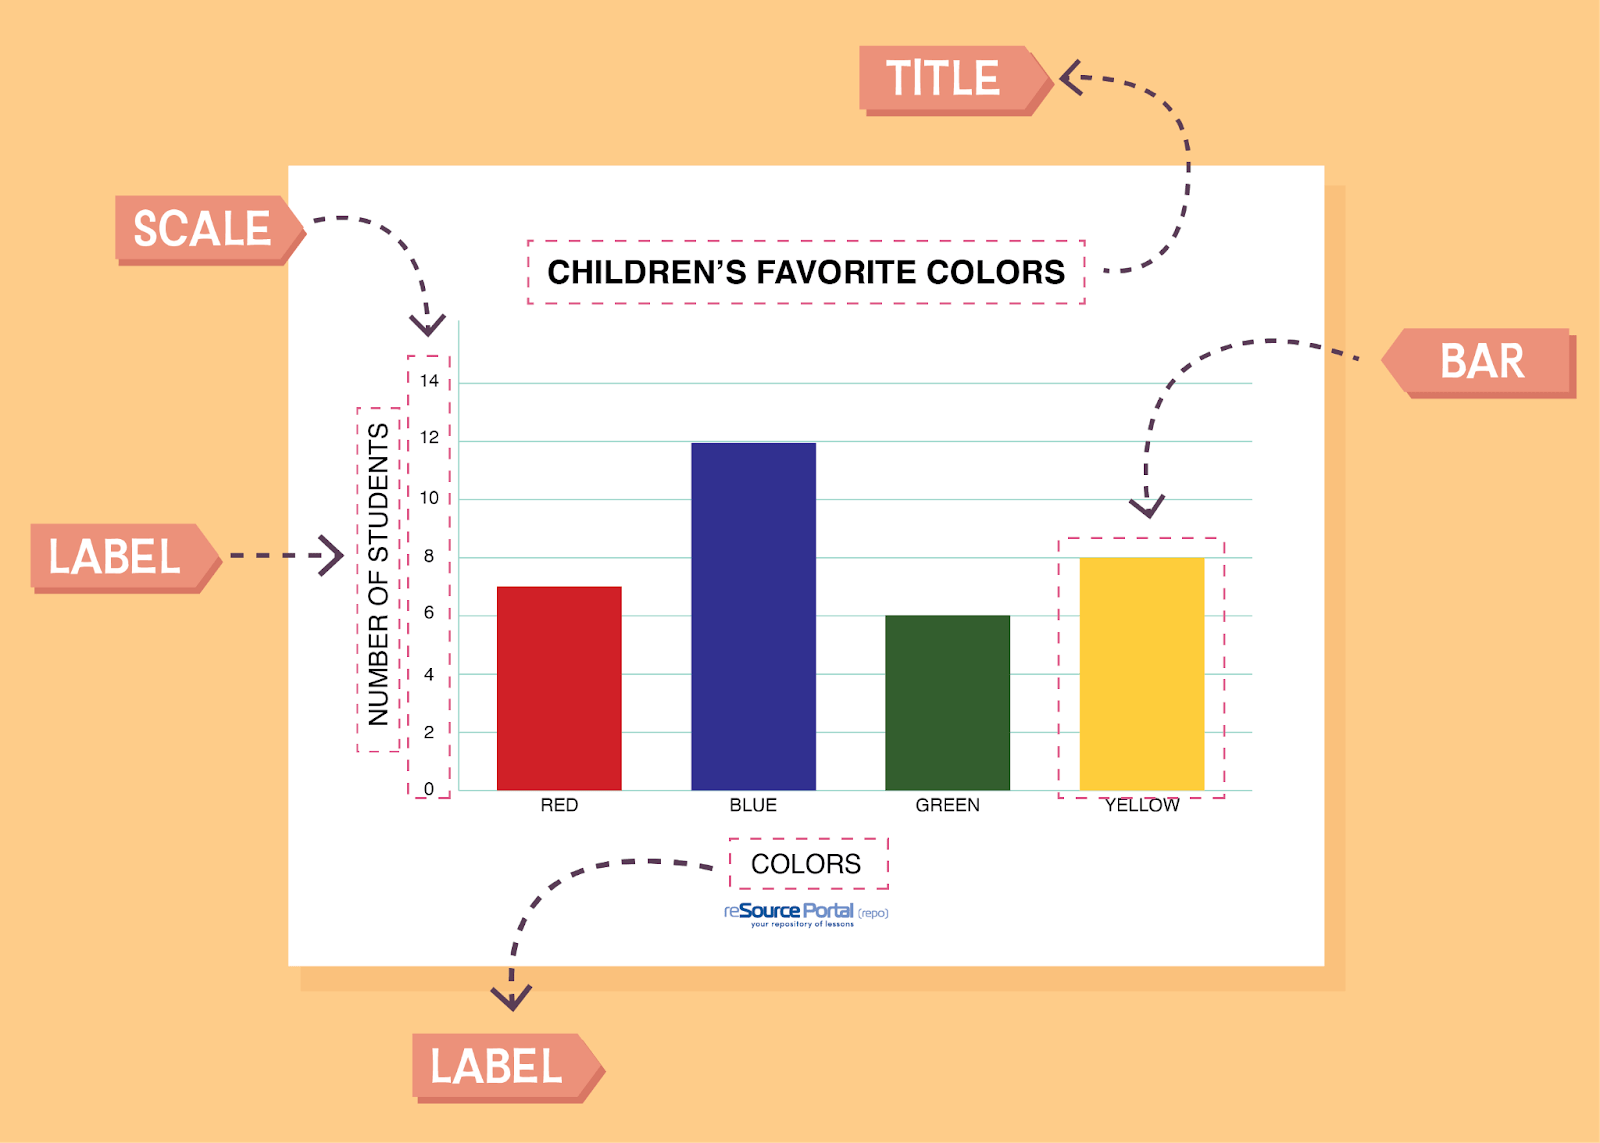
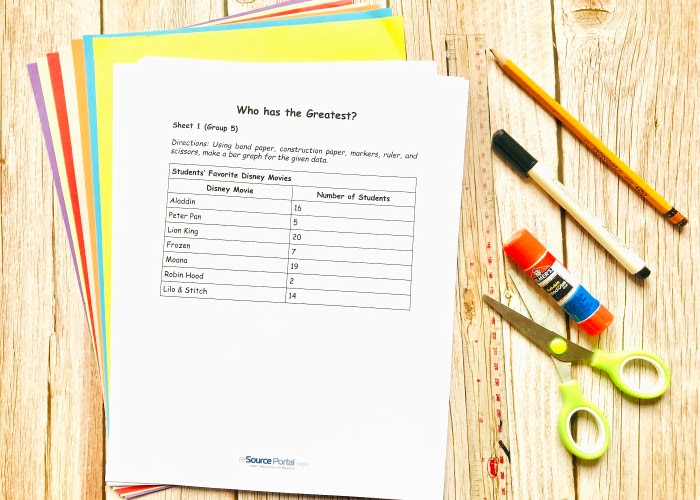
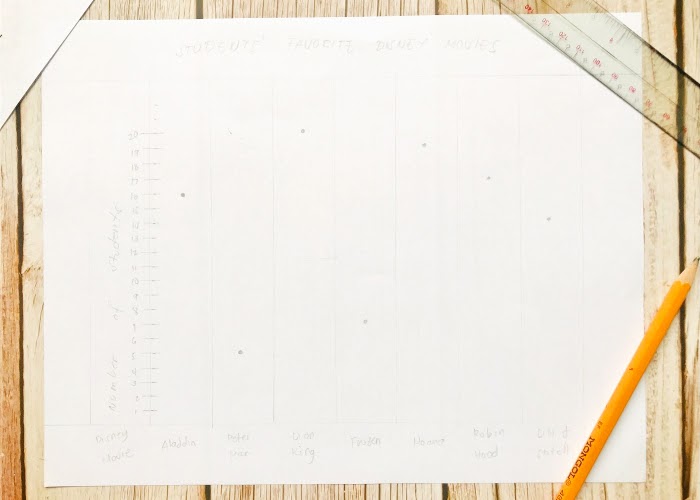
This lesson is all about creating, reading, and interpreting a bar graph. Students will have hands-on experience of creating one. At the end of the lesson, a fun learning activity will be conducted.
- Duration: 1 Hour
- Grade(s): 3rd – 7th


Math and creativity meet in this challenging zoo-building session! Students will play the role of zoo designers who must try to fit animals like tigers, crocodiles and elephants into a public space. Knowledge of perimeter and area will come in handy.

Go whish and whoosh and have a wind-erful time with this STEAM activity. Help your learners create their own windmill scale model that will surely blow their boredom away.

Fractions are easy to learn when having fun! Get to know the differences between similar and dissimilar fractions with this math lesson.

What time is it? It’s Learning Time! Help kids learn to tell the time using their creativity with this art enrichment activity that will let time fly fast because it is fun.
Reviews
There are no reviews yet.