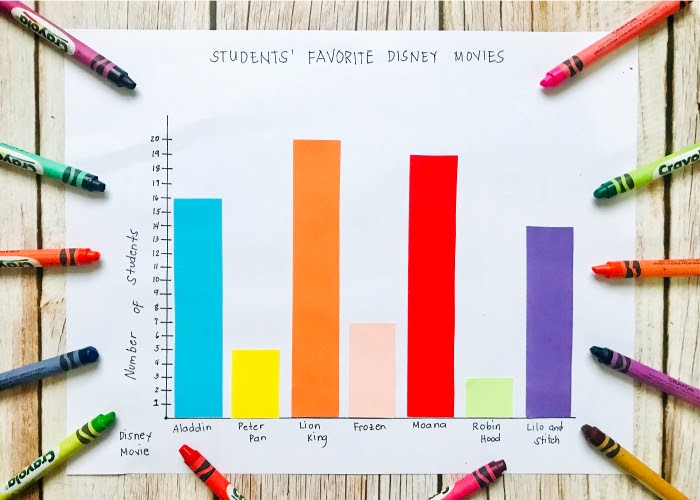
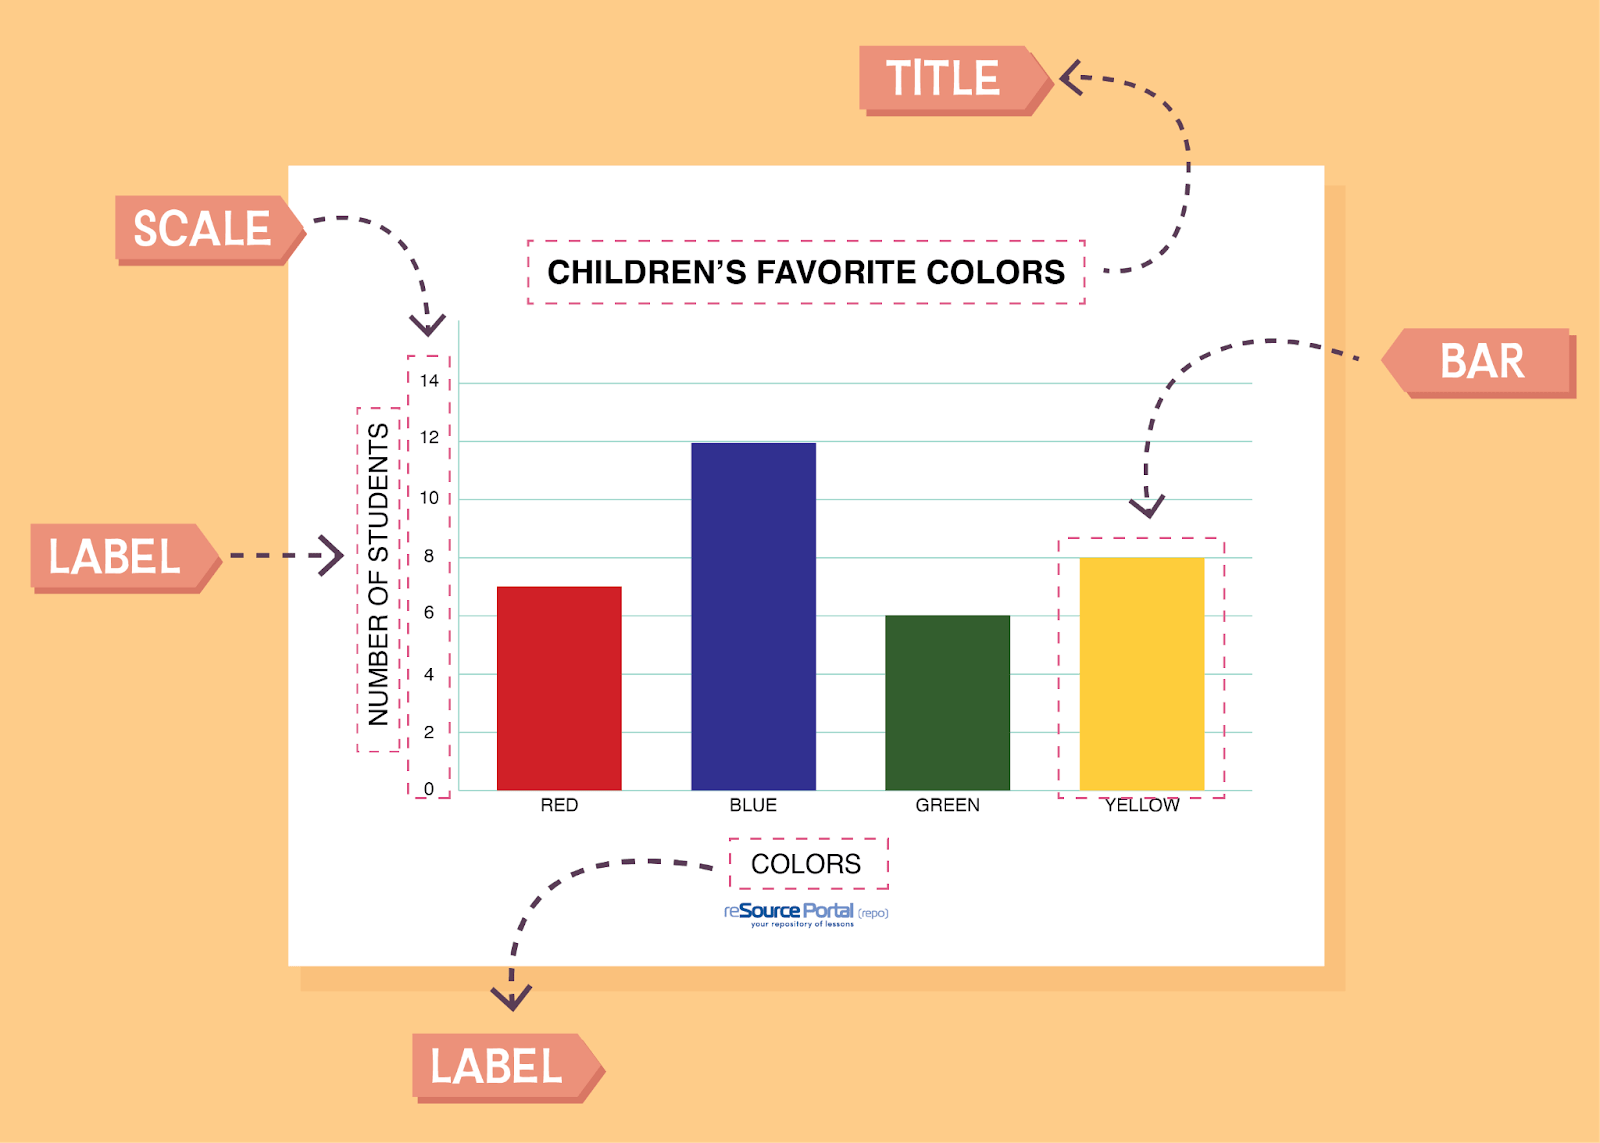
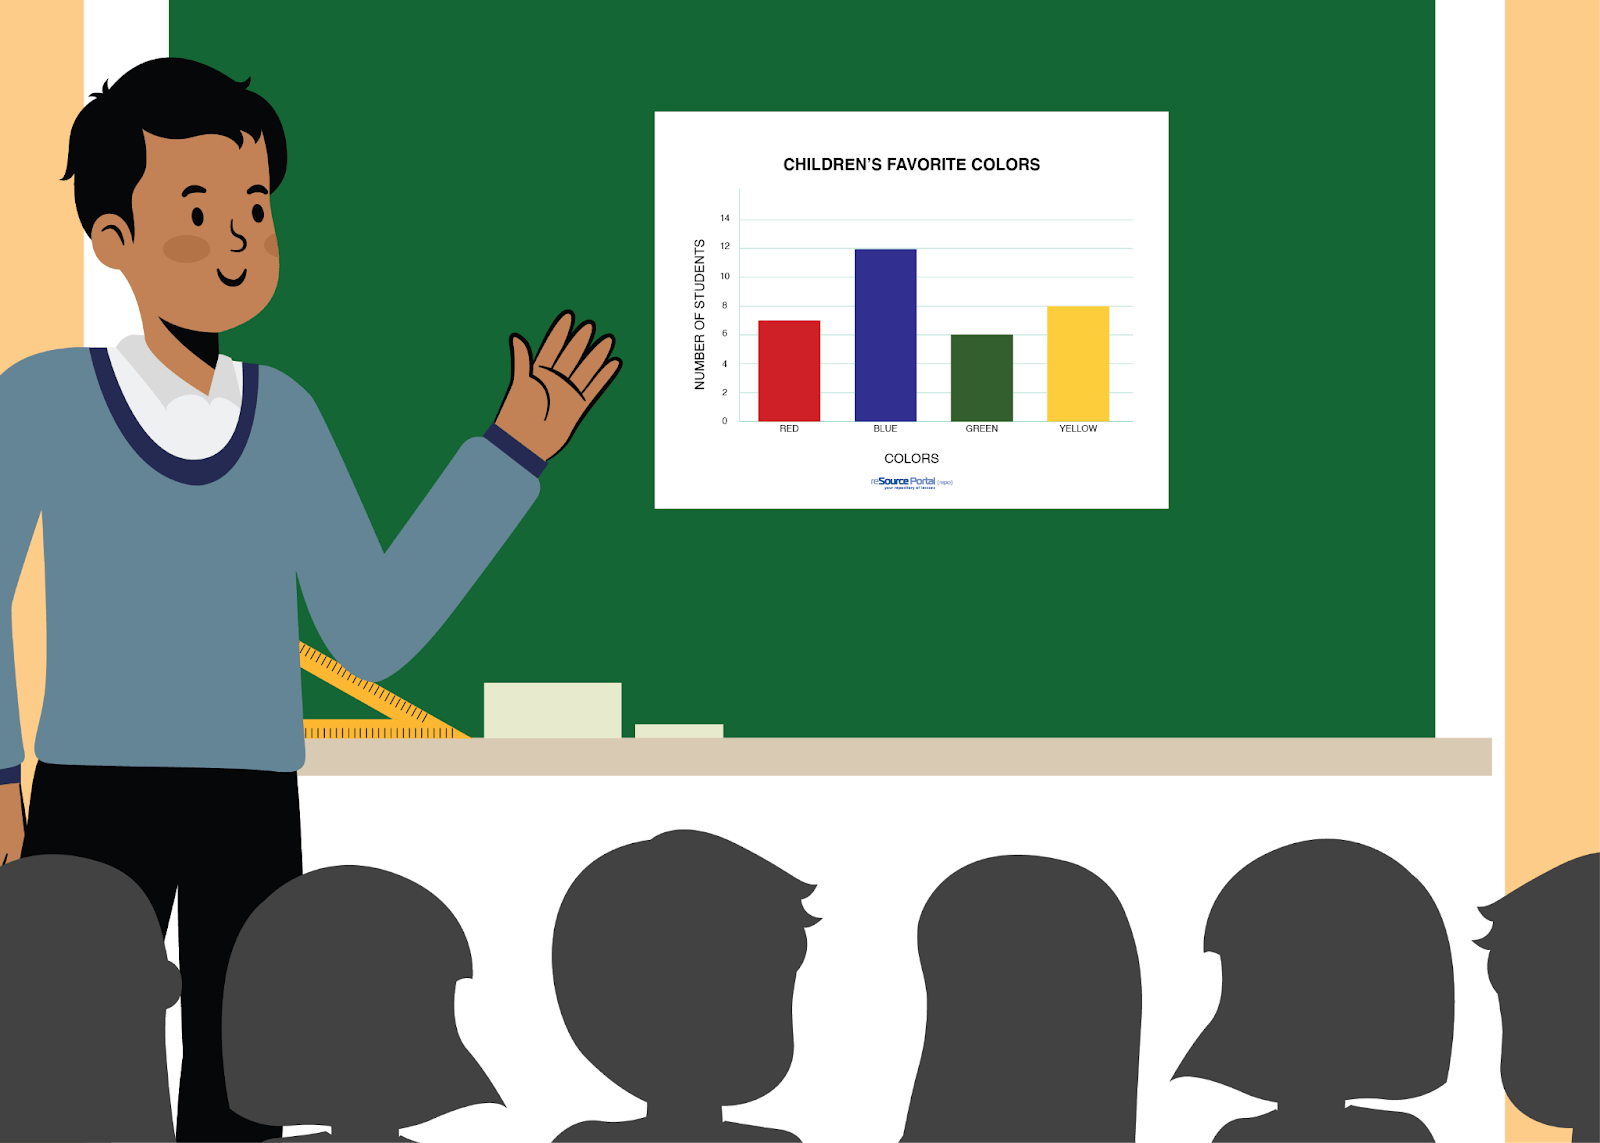
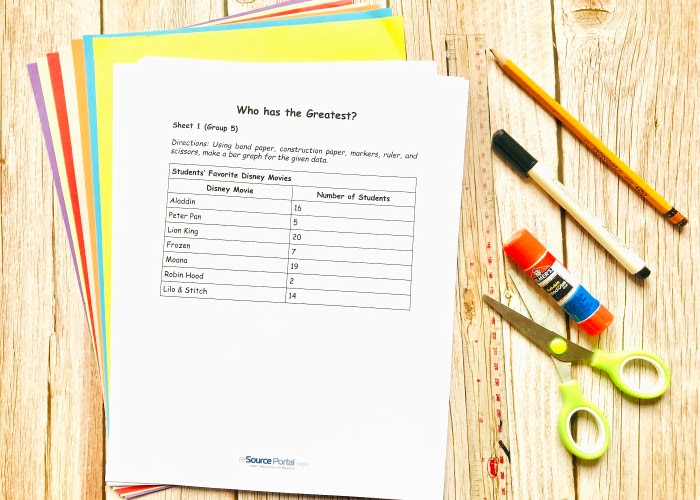
This lesson is all about creating, reading, and interpreting a bar graph. Students will have hands-on experience of creating one. At the end of the lesson, a fun learning activity will be conducted.
- Duration: 1 Hour
- Grade(s): 3rd – 7th

Appropriately solving problems requires us to follow a series of steps. The same concept applies in mathematical problem solving. Equip the students with this knowledge as they take part in this session.

Even different things can have their similarities, too! This also happens to be true between similar and dissimilar fractions. Discover how this is done in this lesson.

Nothing is more natural to humans than eating and it is a such a challenge to act out the motions and emotions that go into feeding one’s self. This subject, intimately familiar to everyone. is a good introduction to drama and movement.

What time is it? It’s Learning Time! Help kids learn to tell the time using their creativity with this art enrichment activity that will let time fly fast because it is fun.
Reviews
There are no reviews yet.