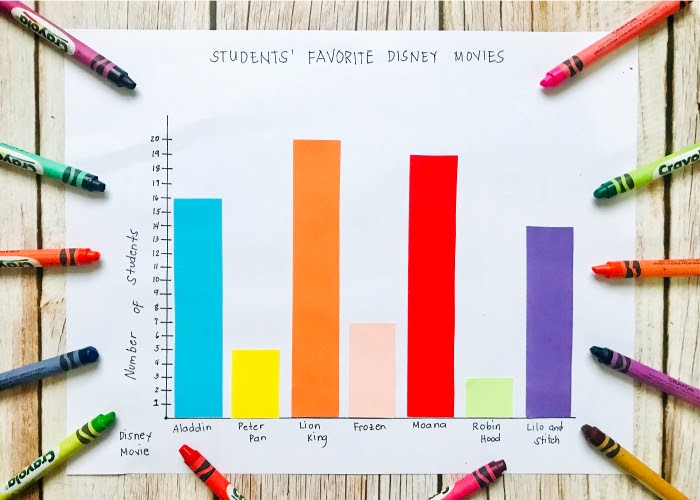
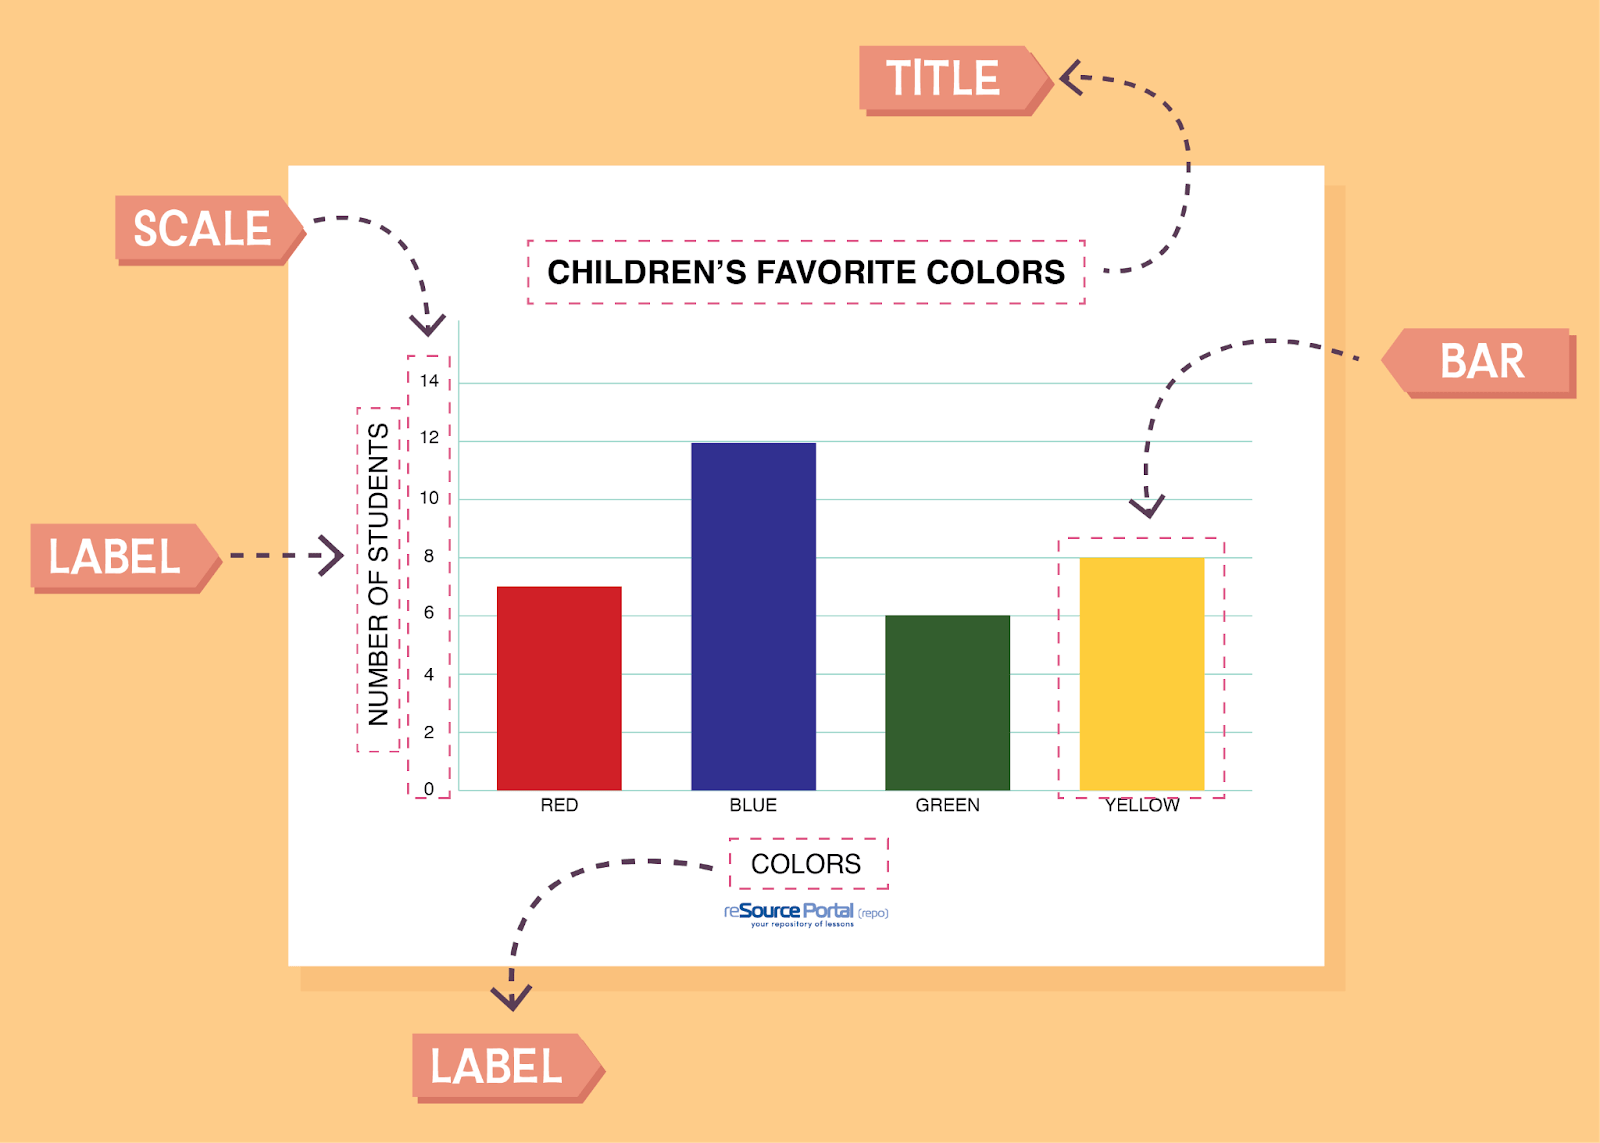
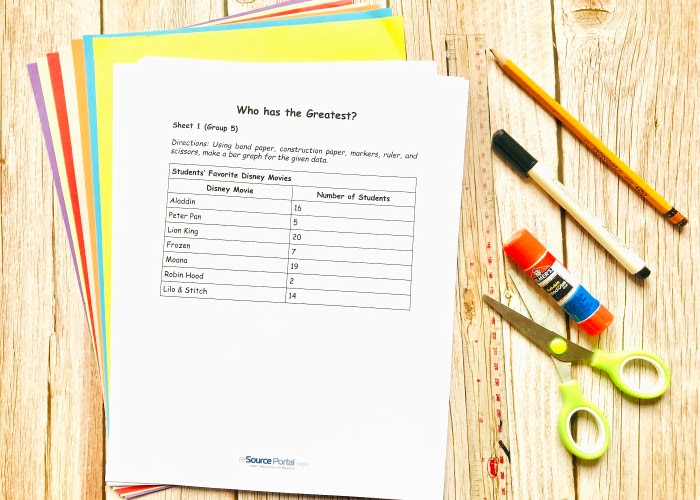
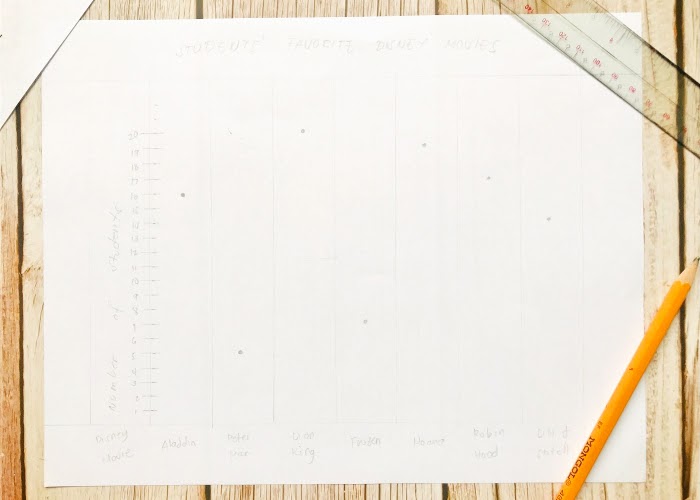
This lesson is all about creating, reading, and interpreting a bar graph. Students will have hands-on experience of creating one. At the end of the lesson, a fun learning activity will be conducted.
- Duration: 1 Hour
- Grade(s): 3rd – 7th


Who would have thought that learning about patterns can be through something therapeutic? Discover how this is possible as students engage and participate in this activity!

Appropriately solving problems requires us to follow a series of steps. The same concept applies in mathematical problem solving. Equip the students with this knowledge as they take part in this session.

Go whish and whoosh and have a wind-erful time with this STEAM activity. Help your learners create their own windmill scale model that will surely blow their boredom away.

Having a hard time figuring the odd ones in numbers? Let this lesson teach you the difference between odd and even numbers in an interactive way!
Reviews
There are no reviews yet.