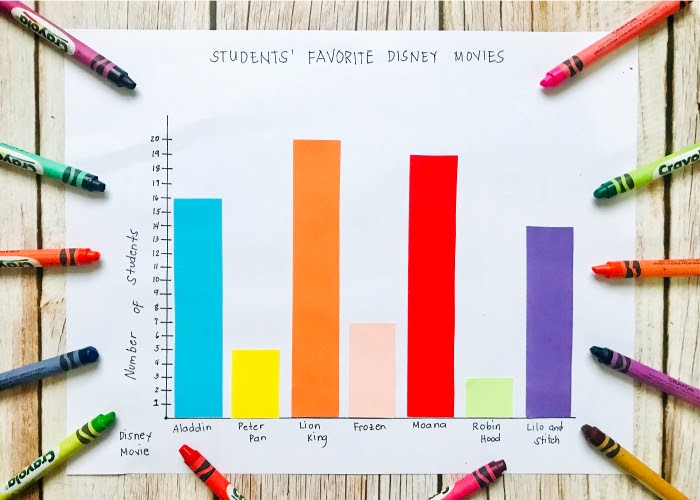
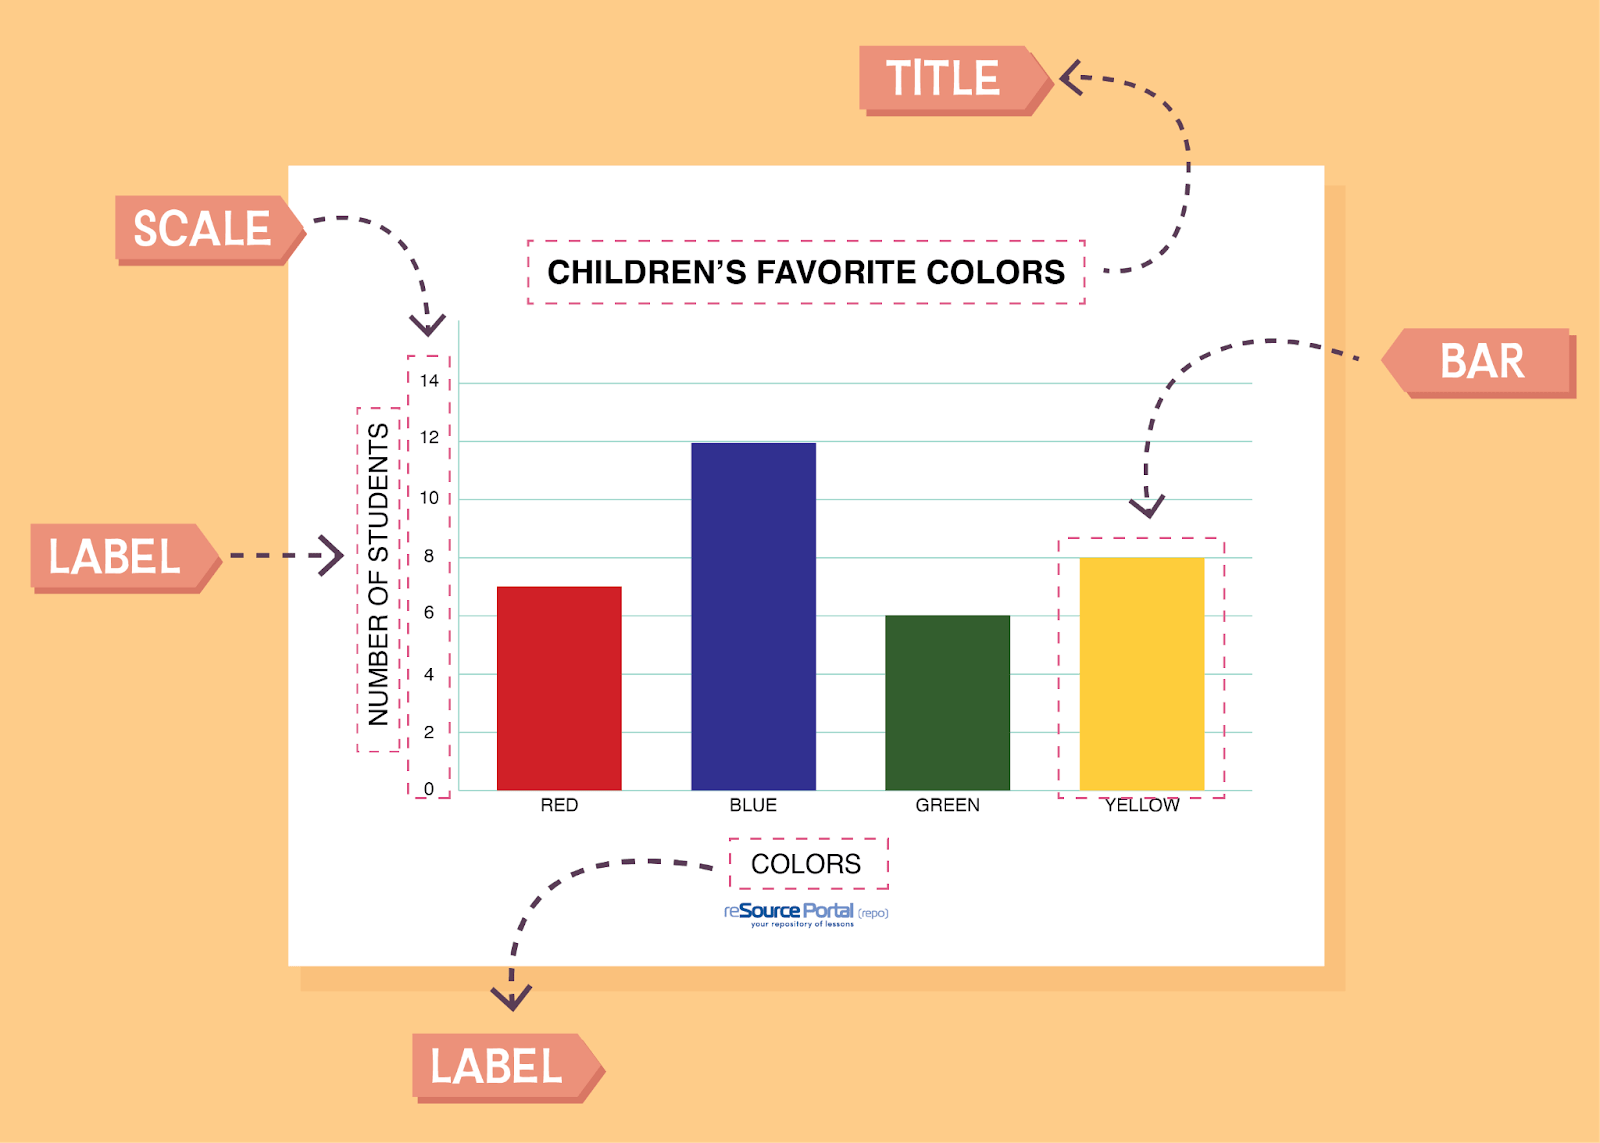
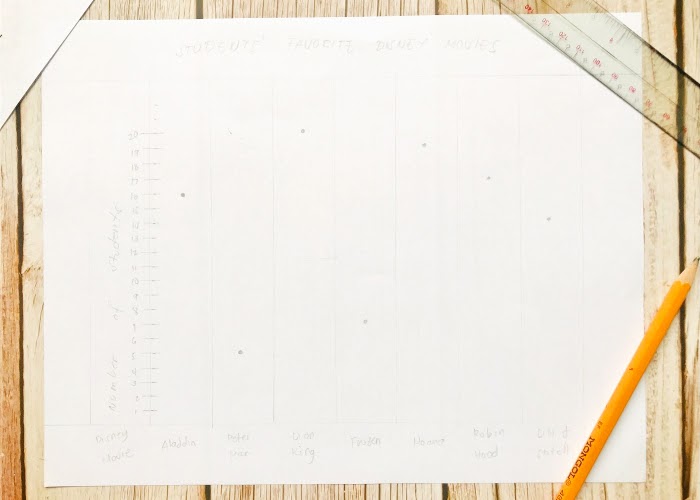
This lesson is all about creating, reading, and interpreting a bar graph. Students will have hands-on experience of creating one. At the end of the lesson, a fun learning activity will be conducted.
- Duration: 1 Hour
- Grade(s): 3rd – 7th
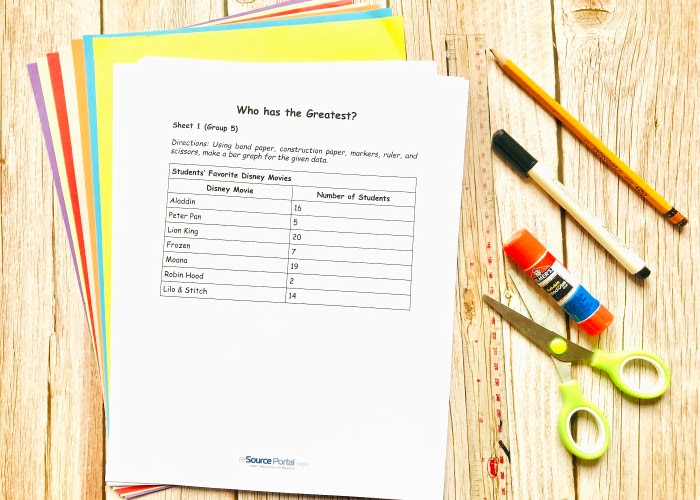

Practice young minds’ counting skills and knowledge in numbers! Their artistic abilities may also pop out in this activity.

Have you ever gone to the grocery store and paid for your purchases only to discover that the total included decimal points? Have you ever wondered what they are used for and how they are solved? Let’s meet the decimals in this activity!

Who would’ve thought that ice cream and mathematics could go together? Well, participating in this activity will let you know exactly how this is done!

Chromatography may sound complicated. But it’s fun and will definitely make you feel artsy and science-y at the same time! Plus, it comes with blooms of lights!
Reviews
There are no reviews yet.