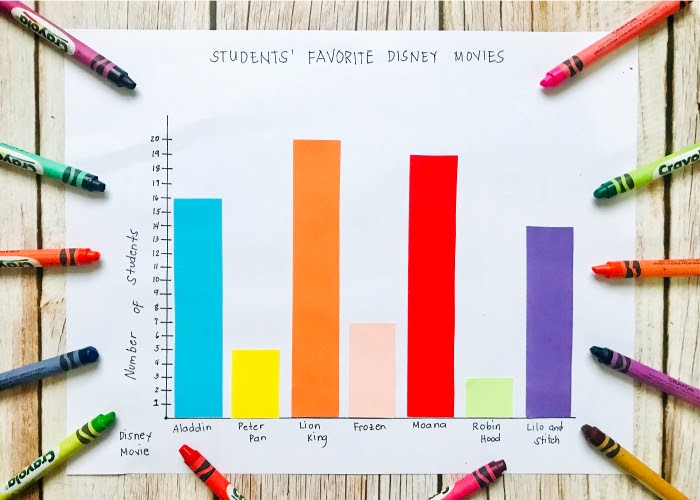
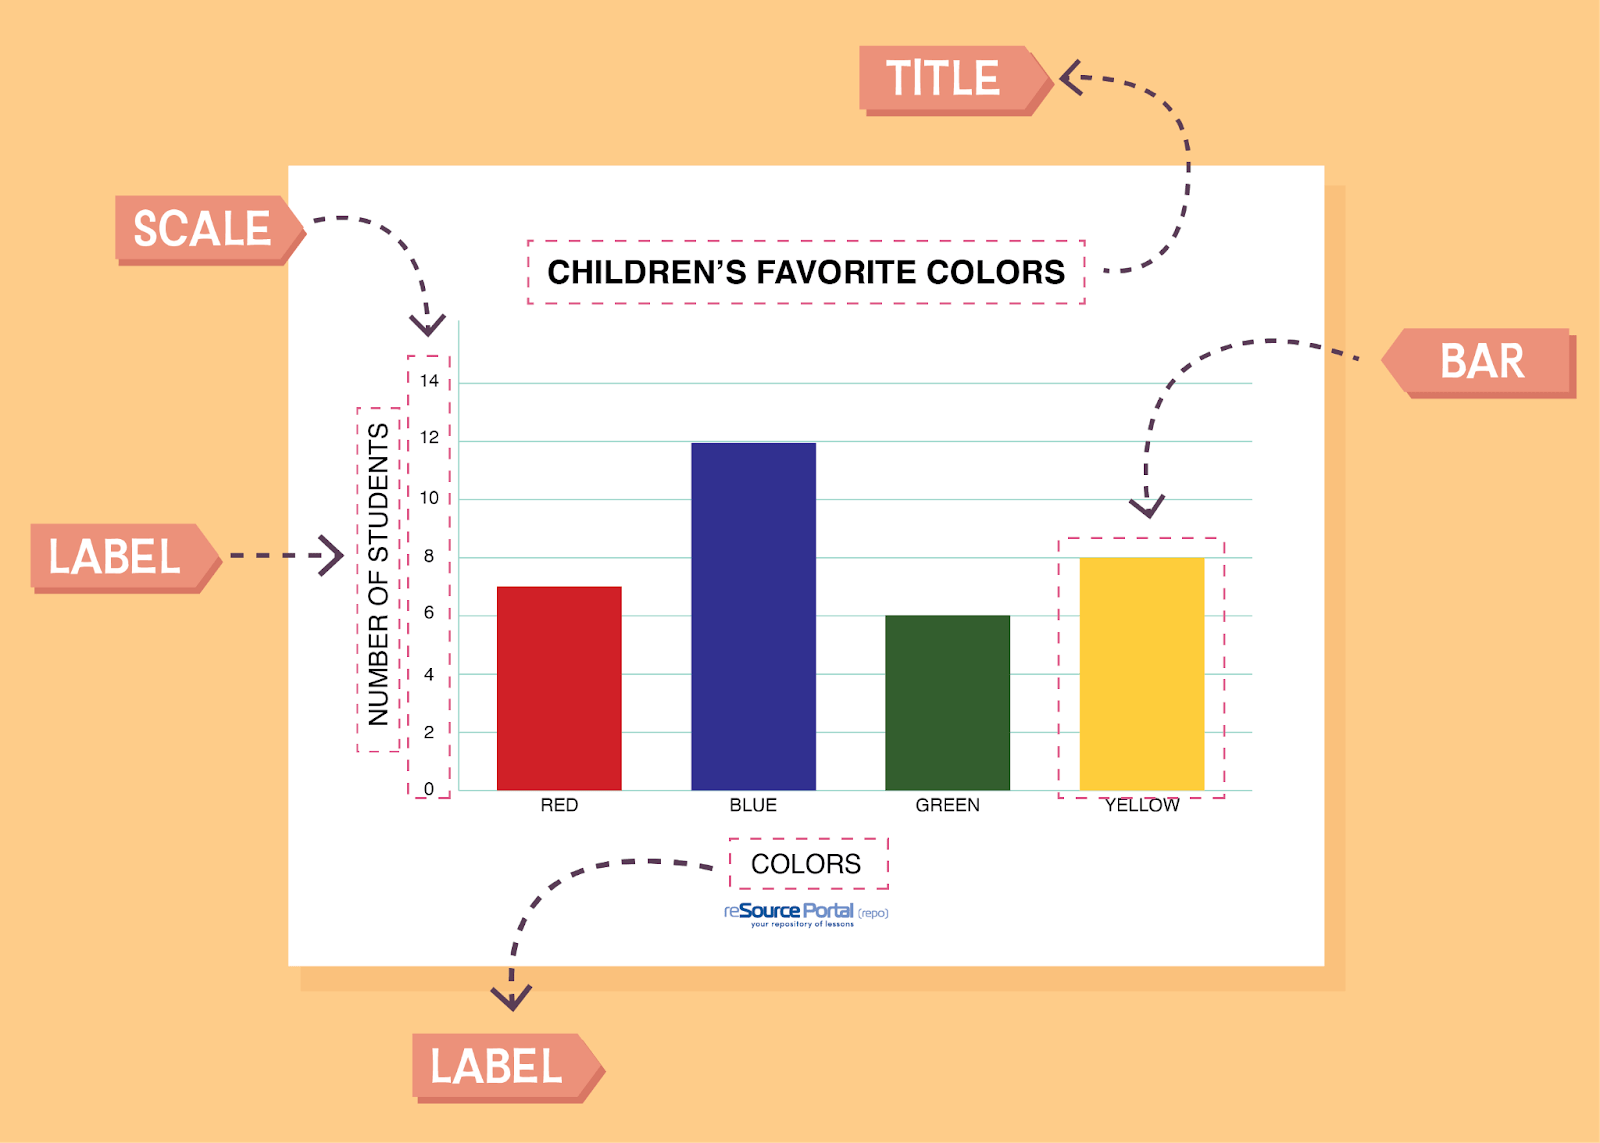
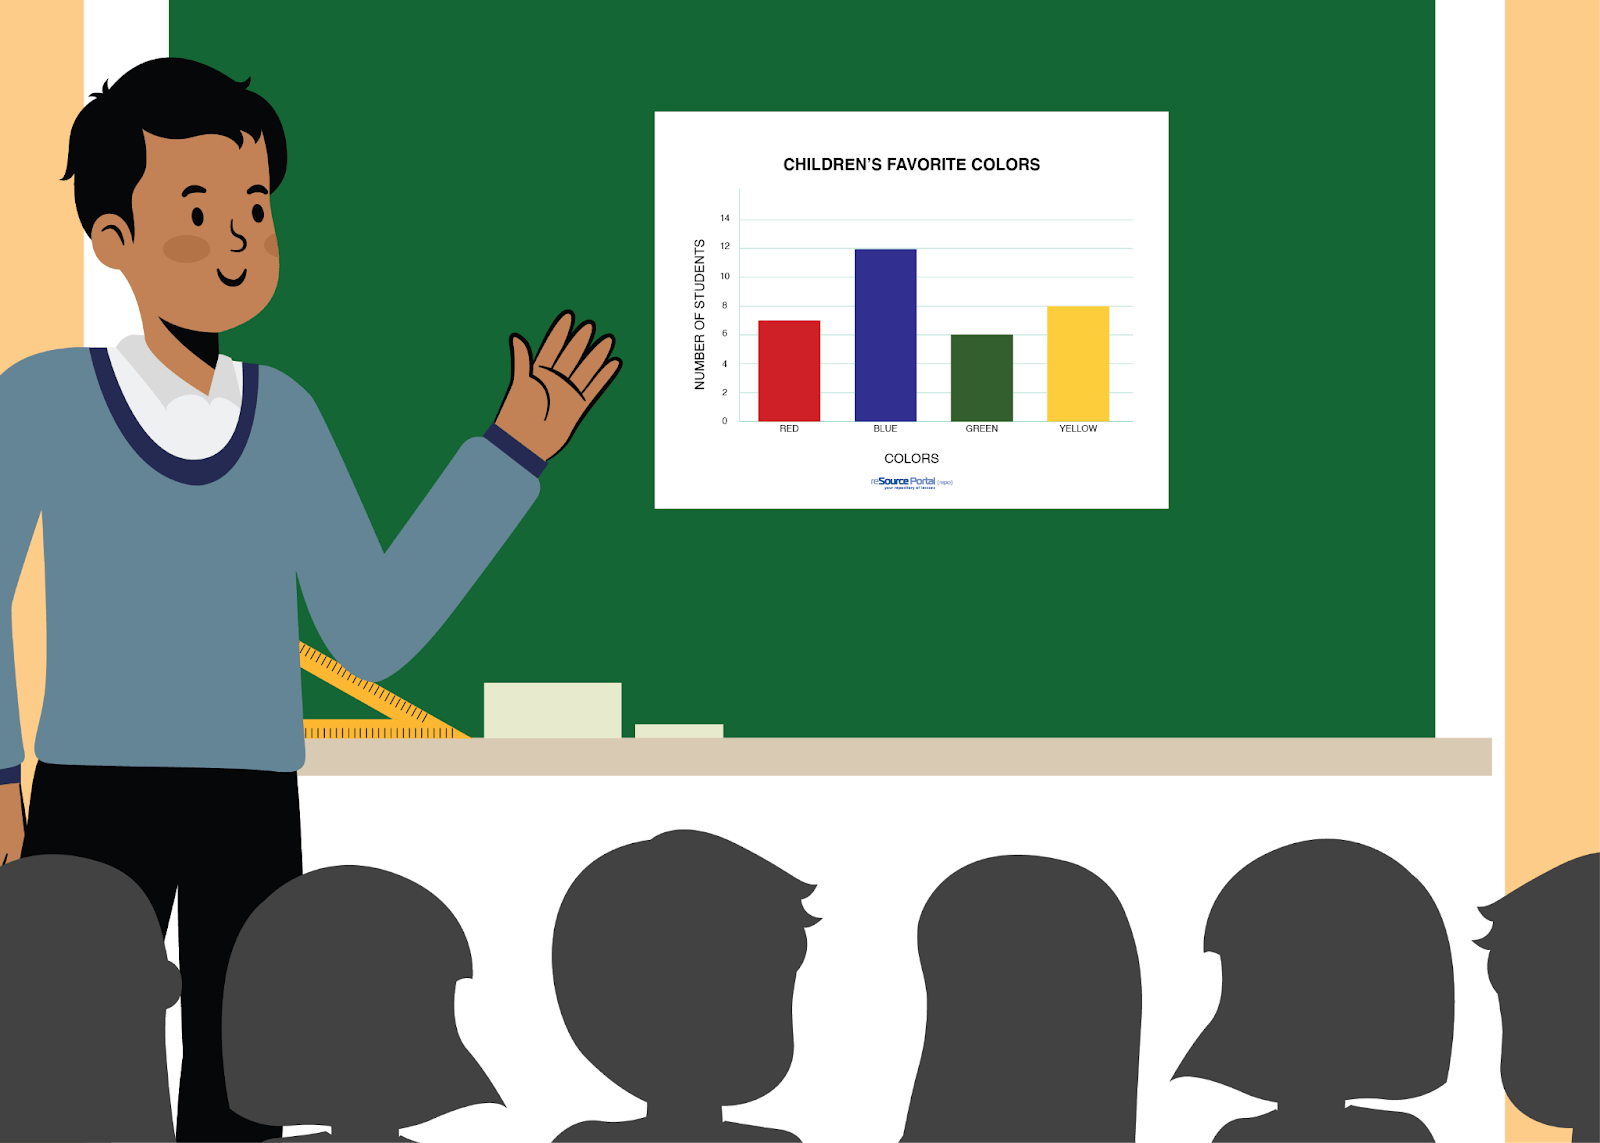
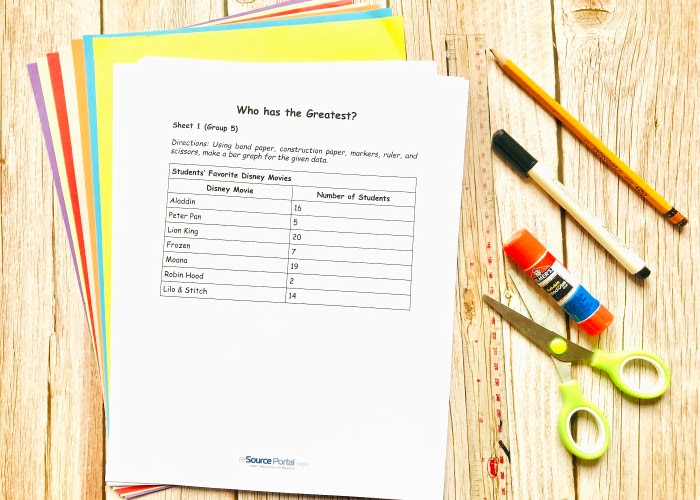
This lesson is all about creating, reading, and interpreting a bar graph. Students will have hands-on experience of creating one. At the end of the lesson, a fun learning activity will be conducted.
- Duration: 1 Hour
- Grade(s): 3rd – 7th

Discover the secret to typing faster and more accurately on your keyboard! Learn the appropriate positions where each of your finger should be positioned on and be ready to type your heart and mind out!

Who would have thought that learning about patterns can be through something therapeutic? Discover how this is possible as students engage and participate in this activity!

Explore the wonders of engineering in this activity where you will be creating a structure that can support heavy loads.

Can you roll a dice and add the numbers that appear? Easy right? But what if we change the faces into fractions? Challenging!
Reviews
There are no reviews yet.